

Market Comments: Q32023

October 2023
Employment numbers weakened a bit over the summer months, averaging around 150,000 new jobs from June through August. Over the previous three-month period, average jobs gains were around 238,000 per month. Fall got off to a better start, with the September employment report showing 336,000 new jobs created, ahead of consensus expectations. The unemployment rate was unchanged at 3.8%.
The report likely increases the possibility the Federal Reserve will raise rates again before year-end. At its policy meeting last month, the Fed kept rates unchanged, after increasing the target rate to between 5.25% – 5.50% in July, its highest reading in 22 years. Post-meeting, fed funds futures indicated about a 50% probability of another rate hike at one of the Fed’s final two meetings of 2023.
A “higher for longer” monetary policy theme took shape over the quarter, as recession forecasts waned and hopes for a soft landing seemed attainable. While not overly robust, economic growth has been resilient. The final second quarter GDP reading came in at 2.1%, a fourth consecutive positive reading after faltering the first two quarters of last year. The current GDPNow forecast for third quarter is 4.9%. The first official GDP estimate for the third quarter will be released late this month.
Inflation remains elevated, though well below the 9.1% peak for the headline consumer price index (CPI) in June 2022. CPI hit a near-term low of 3.0% this June, before regressing a bit in July and August with readings of 3.2% and 3.7%, respectively. The elevated inflation readings and strong jobs report lend support to the higher for longer monetary policy narrative.
Over the last quarter, interest rates moved markedly higher, and beyond just rates on the short end of the U.S. Treasury yield curve that are heavily influenced by monetary policy. The benchmark 10-year Treasury reached its highest level since 2007 and, while still inverted, there was a meaningful flattening of the yield curve. The rise to current cycle-high rates pushed bond values lower (bond rates and prices move inversely).
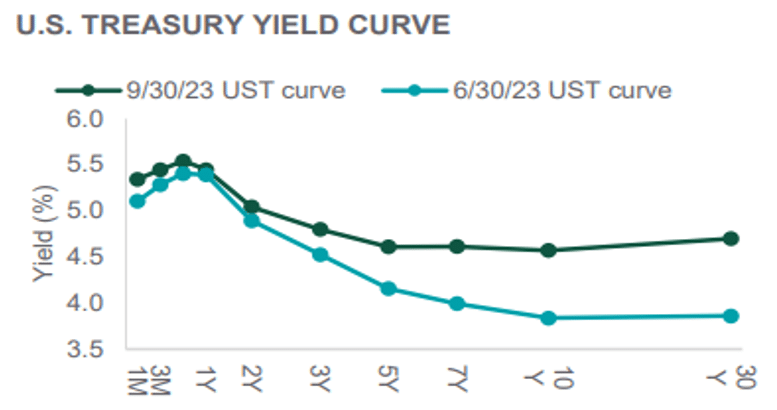
Source: Northern Trust Asset Management
Stock valuations remain elevated, driven higher over the course of the year by growth-oriented sectors and companies, most notably those offering promise for significant advancements in artificial intelligence (AI). It’s too early to know if investors’ high expectations for AI offerings will be met, maybe exceeded, or perhaps the progress will be slow and disappointing.
U.S. stocks got off to a good start early in the quarter, with the Standard & Poor’s 500 Index achieving a fifth consecutive month of positive returns in July. However, stocks stumbled to the finish line. For the quarter, the Dow Jones Industrial Average, the S&P 500 Index and the NASDAQ Composite Index returned -3.3%, -2.1% and -3.9%, respectively. For the year, returns remained strong through three quarters, with the Dow, the S&P 500 and NASDAQ returning 13.1%, 2.7% and 27.1%, respectively.
The third quarter narrative for international stocks was similar, a strong start and weak ending. Total returns of the MSCI EAFE Index and the MSCI Emerging Markets Index for the quarter were -4.0% and -2.9%, respectively. Year-to-date through September, the two indices returned 7.6% and 2.1%, respectively.
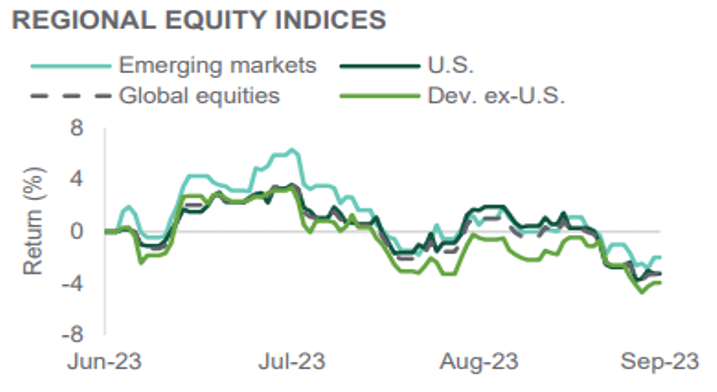
Source: Northern Trust Asset Management
Last month, the 30-year fixed-rate mortgage hit a 20+ year high at over 7.2%. It has continued to ascend higher to around 8.0%. Though household debt service levels remain reasonable because eligible borrowers refinanced their homes during the Fed’s easy-money, pandemic policies, higher rates signal potential trouble ahead, particularly should the employment market weaken or inflation spike again. In addition, energy prices are up, credit card balances are at all time highs at over $1 trillion, and student loan debt payments have resumed.
Stocks typically post the strongest returns of the year in the fourth quarter, including a “win percentage” of 81% since 1980. By comparison, the first, second and third quarters have produced positive returns at a rate of 66%, 66% and 61%, respectively.
AVERAGE QUARTERLY STOCK MARKET APPRECIATION SINCE 1980
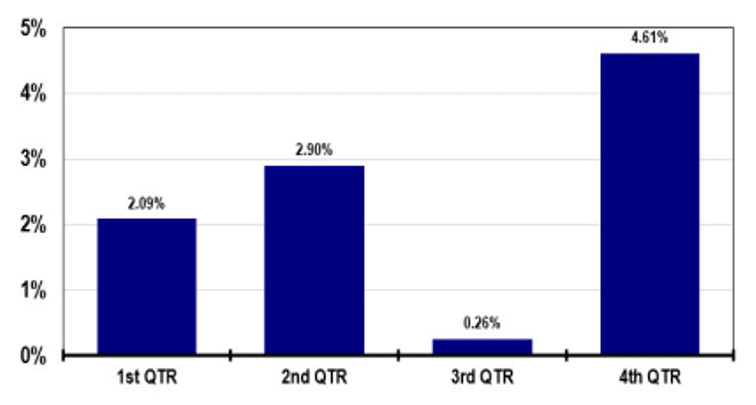
Source: Argus Research
However, there have been some forgettable fourth quarters too, including 1987 (Black Monday) and 2008 (Lehman Brothers collapse), in which stocks were down 23% and 18%, respectively, for the period. Let’s hope there are no such “surprises” on the horizon the remainder of this year.
This material is prepared for informational and educational purposes. It is not and should not be interpreted or relied upon as financial advice, a recommendation for the purchase or sale of securities or other financial products and services, or for tax, legal, or accounting advice. We make no representation as to the accuracy or completeness of the information. With respect to information regarding financial performance, past results are not an indication of future performance. Please know that Investments and other non-deposits are not deposits, not FDIC insured, not guaranteed by the bank, and may lose value. You should consult your professional advisors regarding the matters discussed herein and your own individual circumstances before taking or declining to take.
Start planning for a stronger financial future.
Let us help you build a tailored plan that will help you achieve your financial goals.
Find an Advisor